Graph Editor
Graph Editor is where you author Vista graph assets such as Terrain Graph and Biome Mask Graph.
To open a graph editor, double click a graph asset. In most cases it is more practical to use the Edit button next to the graph slot in your biome Inspector, so the editor opens with the correct context such as world bounds, resolution, and seed.
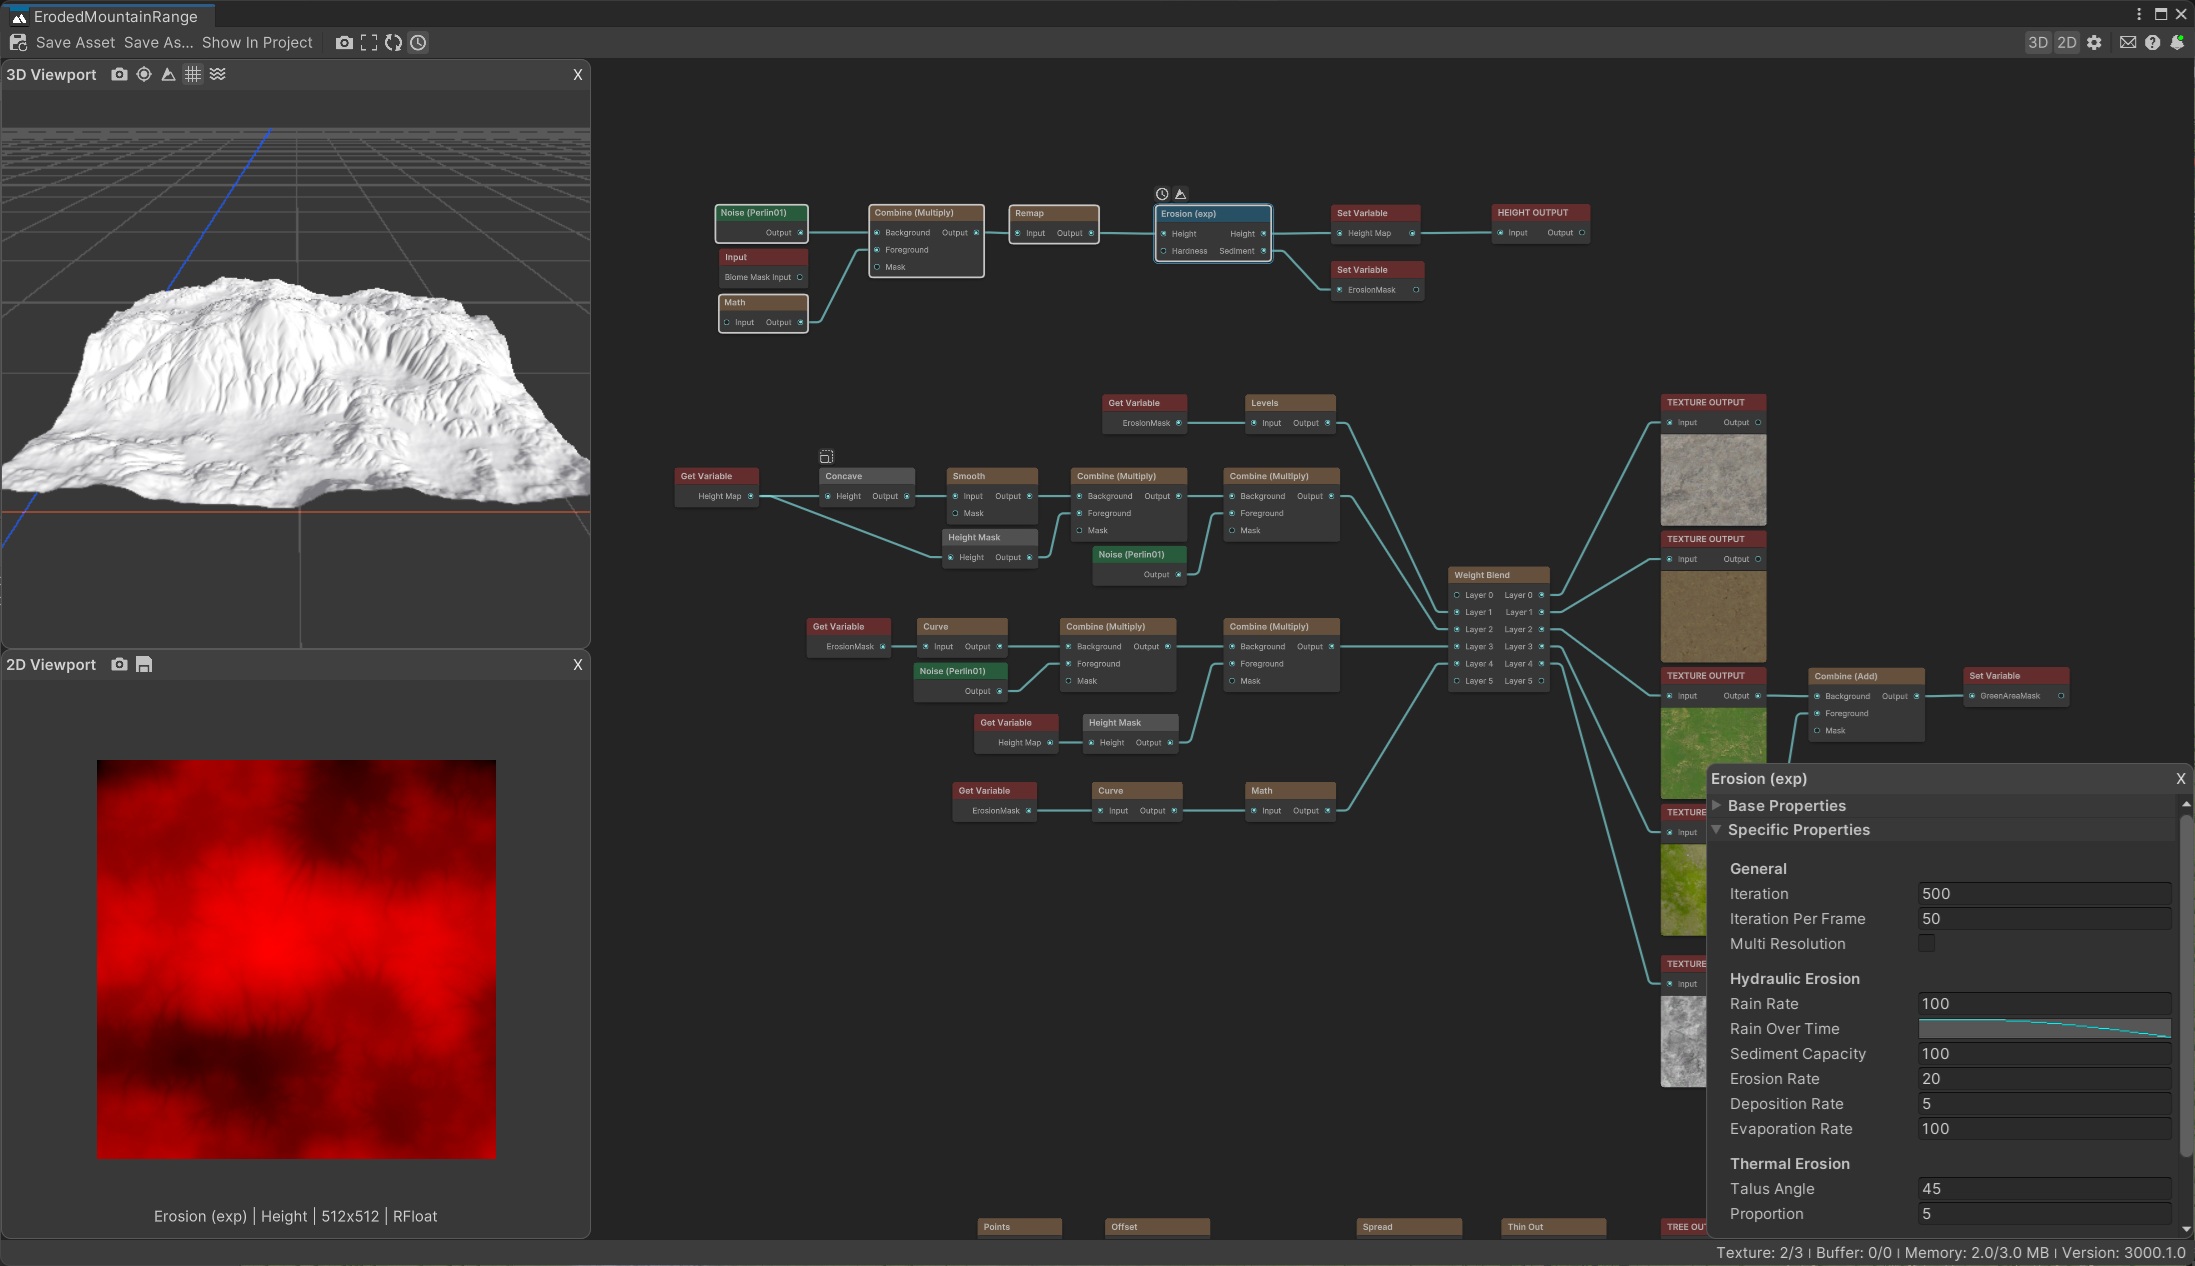
The Graph Editor brings the main working areas together in a single window.
Toolbar

The Toolbar at the top of the Graph Editor.
- Auto Save: when enabled, saves the graph periodically and regenerates the scene.
- Save Asset / Save As: save the graph to an existing or new asset.
- Show In Project: highlight the open graph in the Project window.
- Utility Tools: take a screenshot of graph content, frame the graph, permute graph, and toggle split execution.
- 2D / 3D / Cog Icon: show or hide the corresponding viewport and the graph settings panel.
- Contact & Documentation: show the contact page and online user guide.
3D Viewport
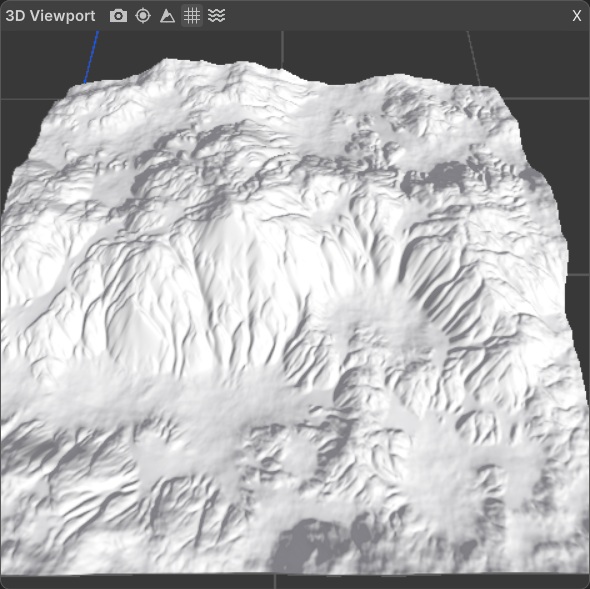
The 3D Viewport visualizes generated data in 3D space.
The 3D Viewport visualizes generated data in 3D space. You can navigate it the same way as the Scene View.
2D Viewport
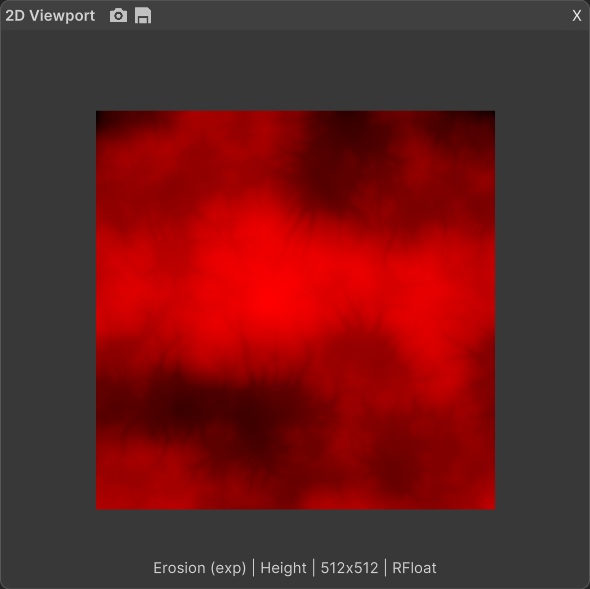
The 2D Viewport visualizes texture and mask data in 2D space.
The 2D Viewport visualizes generated data in 2D space. In some cases it can also be used for editing nodes directly.
Graph View
The Graph View is where you create and connect nodes.
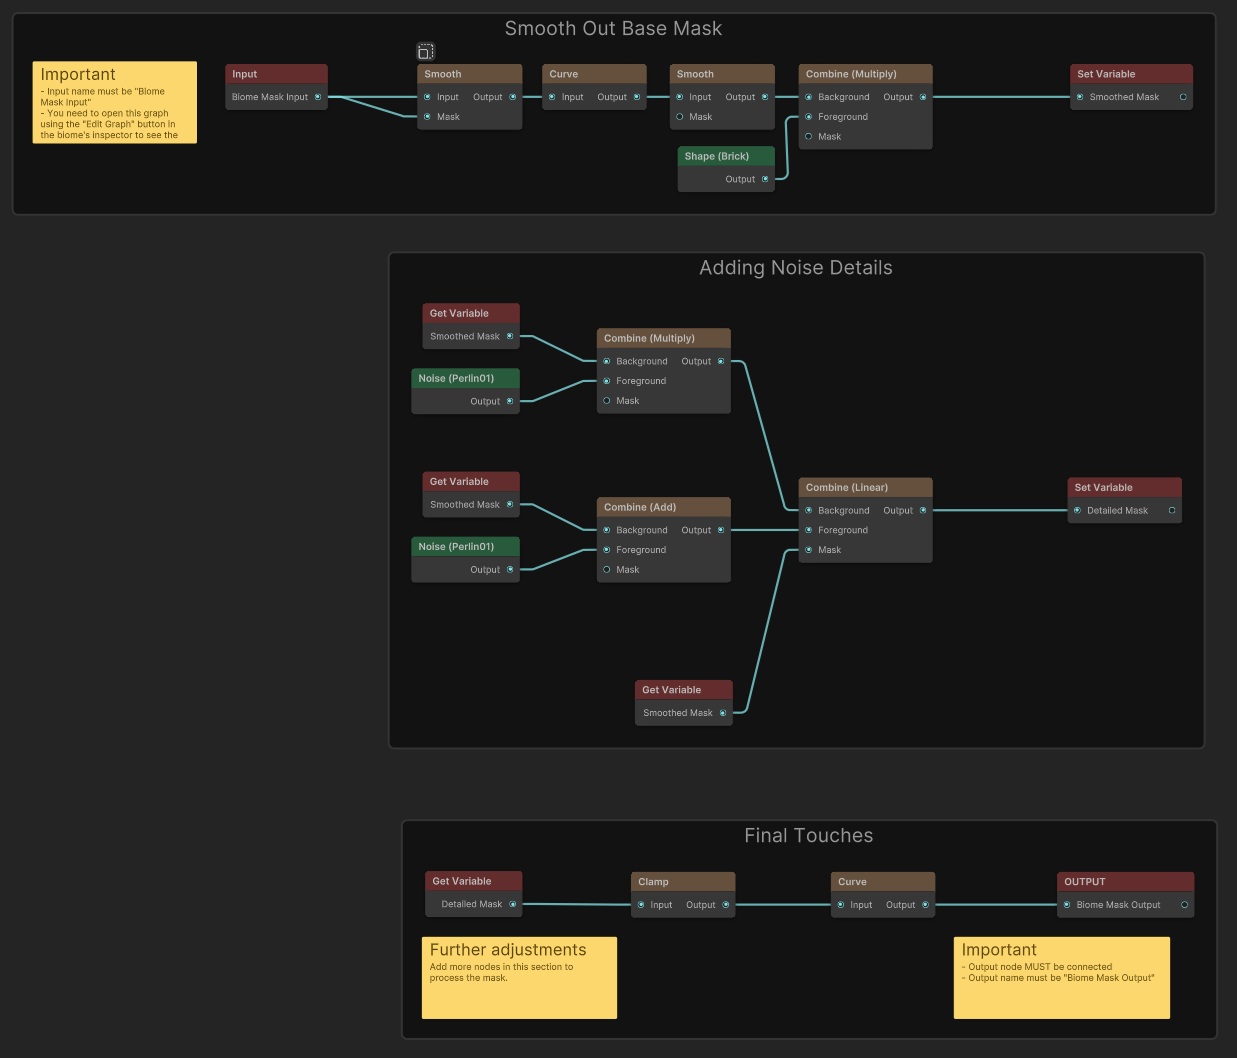
The Graph View with node groups and sticky notes.
Navigation: hold middle mouse to pan, scroll to zoom, left click to select, right click for the context menu.
Adding nodes: right click on a blank space and select Add Node, or press Spacebar to open the node browser. Type the node name and press Enter or double click its entry.
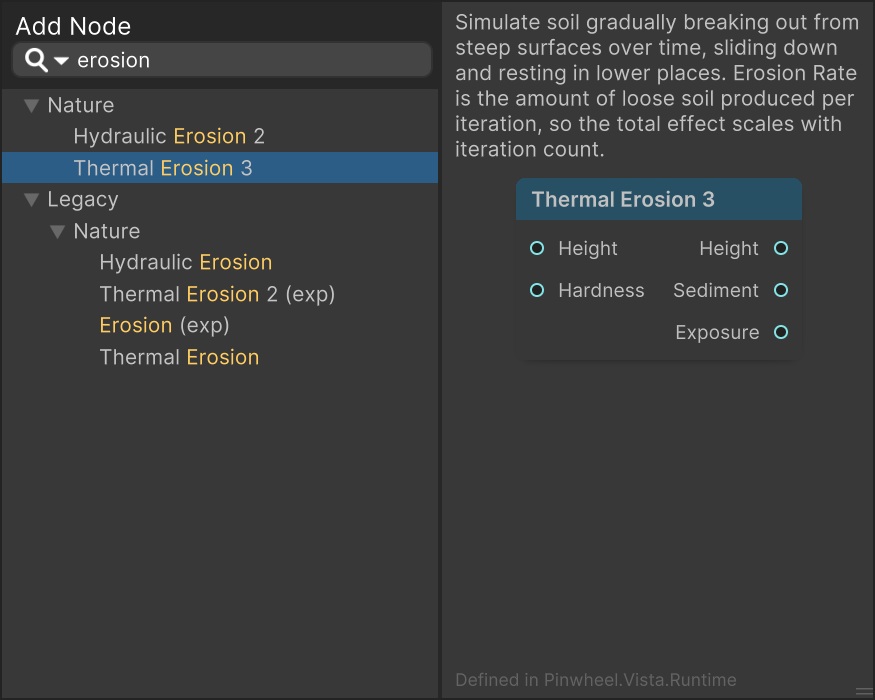
The node browser. Type to filter, Enter or double click to add.
Connecting nodes: drag from an output port and drop onto an input port of another node.
Sticky notes: right click on a blank space and select Add Sticky Note to leave notes about graph sections.
Grouping: select elements, right click, and choose Group Selection. To remove elements from a group, right click and choose Ungroup Selection.
Data Visualization
When you select a node, its first output is visualized in the 3D and 2D viewports.
By default, texture data is interpreted as height in the 3D Viewport and array data is interpreted as positions. To switch between height and mask display, use the Default Texture Display Mode button on the top of the 3D Viewport.

Display mode set to height.
Display mode set to mask.
To lock a specific node's visualization, right click on it and choose:
- Show as 2D: display the output texture in the 2D Viewport.
- Show as Height: display the output in the 3D Viewport as a height map.
- Show as Mask: display the output in the 3D Viewport as a mask.
- Show as Position: display the output array as position markers in the 3D Viewport.
Properties Panel
The Properties View shows the settings for the currently selected node. Select any node in the Graph View to inspect and edit its properties here.
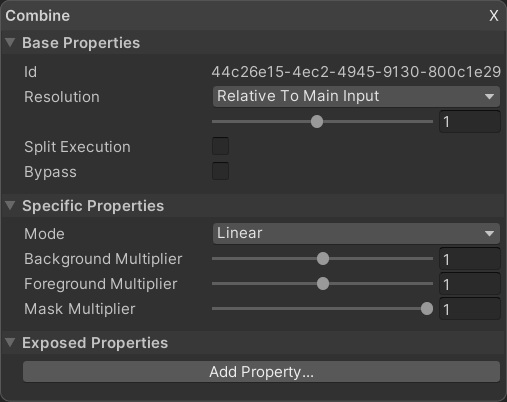
The Properties View with a node selected.
This panel appear when you select a node in the graph view.
Graph Settings Panel
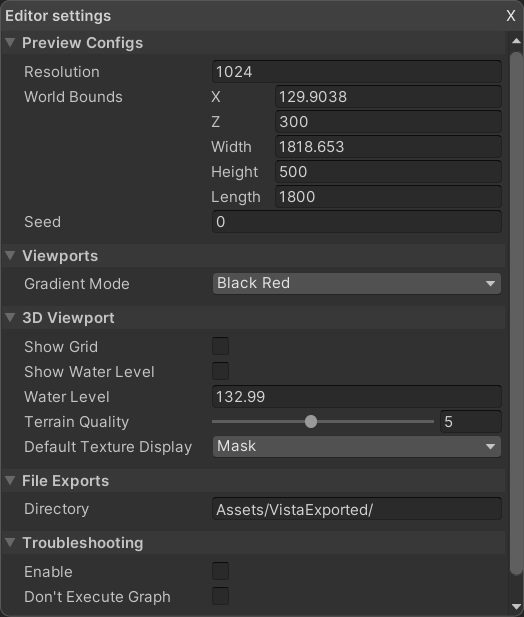
The Graph Settings Panel, opened via the Cog Icon in the Toolbar.
The Graph Settings Panel contains graph-level parameters such as resolution, world bounds, seed, and split execution. Open it by clicking the Cog Icon in the Toolbar. These values are for previewing only — the actual values used during generation are fed from the biome at runtime.
Status Bar

The Status Bar at the bottom of the Graph Editor.
The Status Bar shows current and peak texture count, buffer count, and VRAM consumption.